Carbon Footprint on Site Soil Washing vs Excavation: Choosing the Lower-Emission Remediation Route
Compare the carbon footprint of on-site soil washing against excavation and landfill disposal: emission sources, haulage distance, soil type and the reuse credit for washed aggregate.
Carbon Footprint on Site Soil Washing vs Excavation: Choosing the Lower-Emission Remediation Route
When a contaminated site has to be cleaned up, the project team usually compares two routes: dig everything out and send it to landfill, or treat the soil where it lies. Cost and schedule dominate that discussion, but carbon reporting has joined the list of decision criteria, and in Europe it is now often written into tender documents. Comparing the carbon footprint on site soil washing vs excavation and disposal is therefore no longer an academic exercise - it is a question that clients, regulators and lenders ask before a contract is awarded. The comparison below explains where emissions arise in each route and what site conditions tip the balance. 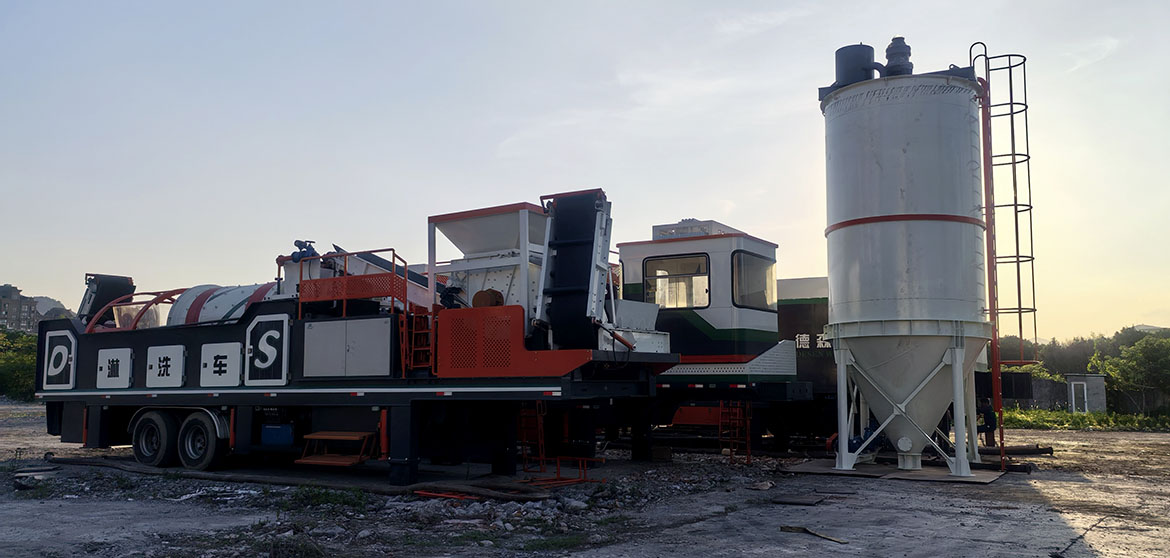
Where the Emissions Come From in Each Route
The two routes move material in fundamentally different ways, and that is what drives the difference in emissions.
Excavation and off-site disposal
Dig and dump is simple on paper, but every tonne of contaminated soil has to be lifted, loaded onto trucks, hauled to a landfill or treatment facility, and often replaced with clean fill brought back to site. Diesel plant burns fuel during excavation and handling, truck fleets account for the largest share, and landfill operations add their own energy use. The longer the haulage distance and the heavier the soil, the faster the emissions add up. In urban projects where licensed landfill capacity sits hours away, transport alone can dominate the carbon account.
On-site soil washing
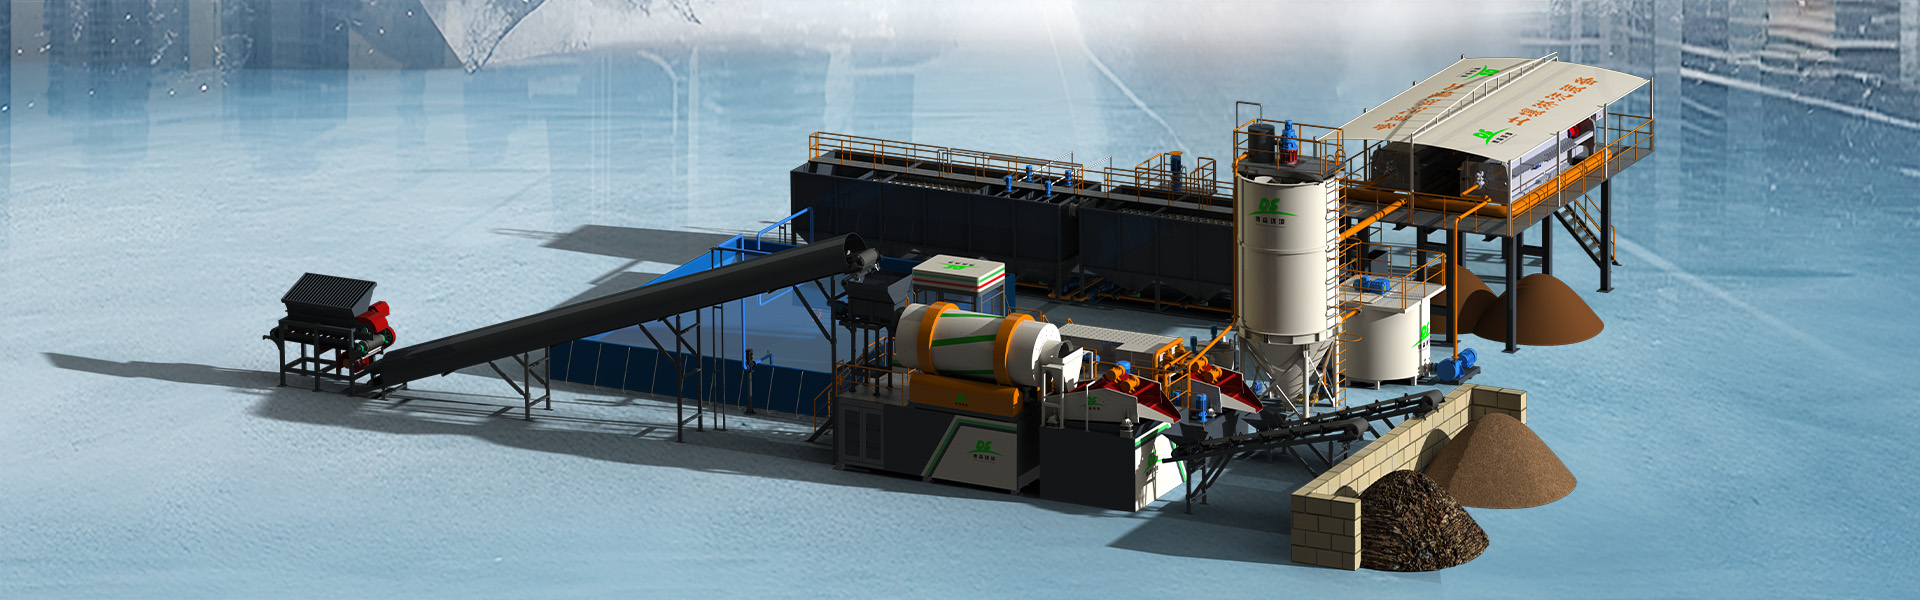
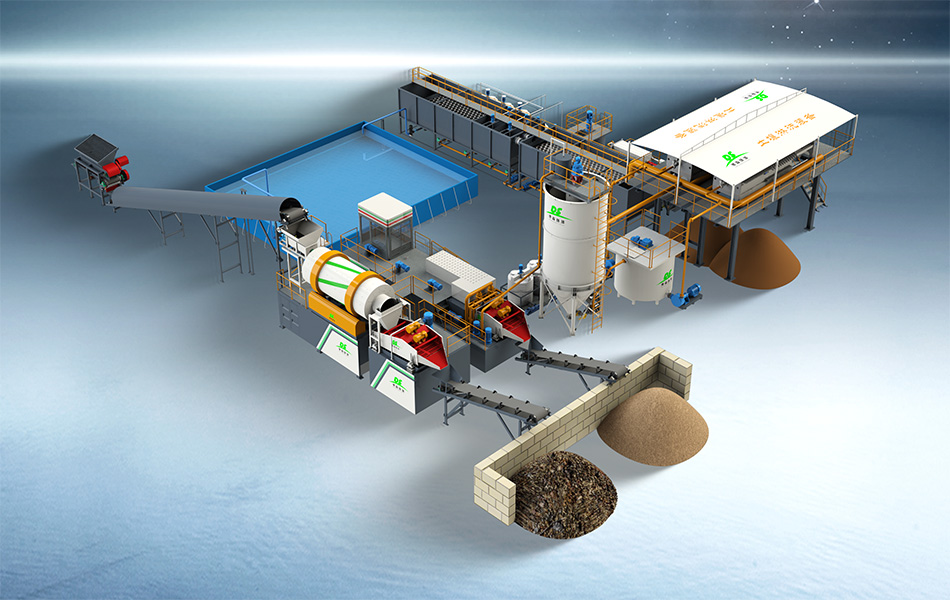
A soil washing plant treats material where it sits. Contaminated fines are separated from coarser fractions, the wash water is recycled through a closed loop, and only a small concentrated residue - typically the fine fraction that holds most of the contamination - leaves the site for disposal. Emissions come from the electricity or generator fuel running the plant, a short haul for the concentrated residue, and delivery of reagents. Because the bulk of the soil stays on site and can often be reused as engineered fill, the tonnage moved by truck drops sharply compared with full excavation.
- Excavation route: diesel for digging and loading, long-haul trucking of the full volume, landfill operations, and quarrying plus return haulage of replacement fill
- Washing route: plant power consumption, a short haul for concentrated fines, reagent production and delivery, and water treatment within a recirculating loop
- Reuse credit: washed sand and gravel fractions can substitute for quarried aggregate, avoiding emissions that would otherwise come from primary material production
How the Numbers Compare Per Tonne
Precise figures depend on the site, but screening-level estimates published in remediation literature point the same way: moving soil by truck is carbon-intensive, so the route that keeps the most tonnage in place usually wins on footprint. As an indicative order of magnitude, long-distance haulage of excavated soil can push the carbon intensity of dig-and-dump several times higher than treating the same soil on site, where the main energy input is electrical. The exact ratio varies with haul distance, soil type and the contamination target, so a project-specific calculation matters more than a generic benchmark. 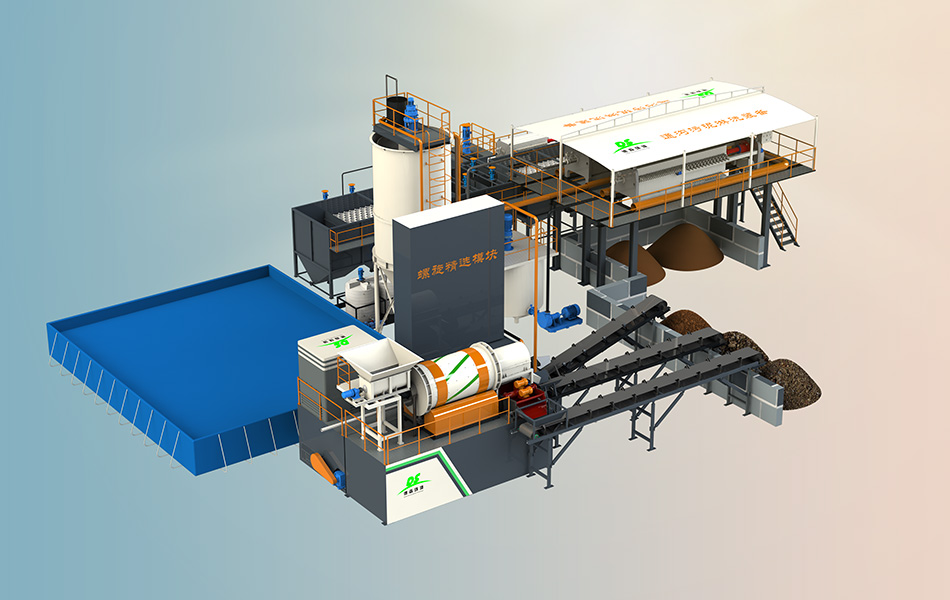
Two variables do most of the work in the calculation. The first is haulage distance: for a landfill one hour away, the truck share is large but not overwhelming; for a site where the nearest accepted facility is several hours away, excavation emissions climb quickly. The second is the fraction of soil that can be recovered and reused. Soil washing works precisely because most contamination binds to fine particles. If a site has, for example, 70 percent sand and gravel that washes clean and only 30 percent fines needing disposal, the washing route converts roughly two thirds of the excavation and transport burden into on-site electricity - and the recovered aggregate avoids quarry demand on top of that.
Practical Factors That Shift the Balance
Haulage distance and landfill access
Short hauls to a nearby, willing landfill narrow the carbon gap between the two routes, while long hauls widen it. Sites in dense urban areas or regions with limited disposal capacity benefit most from treatment in place.
Soil type and the washable fraction
Coarse-grained soils with contamination held in the fines are the natural fit for washing and produce the strongest carbon advantage. Soils dominated by clay, where a large share of the volume ends up as dewatered filter cake, reduce the recovered fraction and weaken the case. A pilot test before committing gives the real split instead of an assumption.
Energy source on site
A plant powered from the grid in a country with a low-carbon electricity mix carries a smaller footprint than the same plant on diesel generators. Where grid connection is not practical, sizing the generator correctly and avoiding part-load running keeps the energy share of the carbon account under control.
For contractors and consultants across Europe and North America, the comparison should be made with project data: the volume to treat, the distance to the nearest disposal facility, the expected clean fraction from a pilot wash, and the local electricity factor. In many projects we review at Desen Environmental, on-site washing with a modular plant cuts the tonne-kilometres moved by a wide margin while returning aggregate to the site, which is why carbon reporting increasingly favors treatment over disposal. To run the comparison on your own site figures, contact Desen Environmental at materialwashing.com for a project-specific assessment.